ZIP Code :
We have gathered the data through web scraping various sources such as Guidestar, social media pages related to the organizations and also reached out to the non-profit organizations to complete surveys that we’ve posted, ensuring that we have up-to-date and detailed information about each organization.
The collected data has been meticulously validated and formatted to ensure accuracy and consistency. During the validation process, we identified instances where multiple entries exist for the same organization, particularly in the case of nonprofit organizations with chapters:
- Duplicate Identification: We identify organizations that have multiple entries, particularly when chapters operate as separate entities under the umbrella of a larger nonprofit organization.
- Removal: To ensure clarity and accuracy in our dataset, we remove duplicate entries for organizations with chapters, streamlining the information to eliminate redundancy.
We used the Geographic Information System (GIS) technology to create interactive maps that visually represent the geographical distribution of nonprofit organizations across the state. Through our rigorous data gathering, validation, and mapping processes, we ensure that the information provided is accurate, comprehensive, and easily accessible.
The below GIS map showcases the distribution of nonprofit organizations across the state, providing valuable insights for stakeholders and decision-makers.

Density of Arlington Non-Profits by Zip Code
IRS Subsection :
Each of these IRS subsections represents a specific category or type of nonprofit organization, each with its own eligibility criteria, tax benefits, and operational guidelines. The categorization of nonprofit organizations adheres to standard classification criteria, ensuring each organization is accurately placed within on of the below corresponding IRS subsection:
- 501(c)(3): This subsection pertains to charitable organizations, including those involved in religious, educational, charitable, scientific, literary, testing for public safety, fostering national or international amateur sports competition, and preventing cruelty to children or animals. These organizations are eligible for federal tax exemption, and contributions made to them are typically tax-deductible for donors.
- 501(c)(6): This subsection is designated for business leagues, chambers of commerce, real estate boards, and professional football leagues (excluding the NFL). These organizations must not be organized for profit, and no part of their net earnings can benefit any private shareholder or individual.
- 501(c)(7): Social and recreational clubs fall under this subsection, including organizations established for pleasure, recreation, and other nonprofitable purposes. Such clubs are typically membership-based and provide various social and recreational activities for their members.
- 501(c)(4): Social welfare organizations are covered under this subsection, encompassing civic leagues or organizations not organized for profit but operated exclusively for the promotion of social welfare. These organizations may engage in lobbying and political activities to further their social welfare purposes, but these activities cannot be their primary purpose.
- 501(c)(8): Fraternal beneficiary societies and associations operating under the lodge system are classified under this subsection. These organizations provide benefits, such as life, sick, accident, or other benefits, to their members or their dependents.
- 501(c)(5): Labor, agricultural, or horticultural organizations fall under this subsection. These organizations are primarily composed of members who are either employees in a trade or business, or individuals engaged in agricultural or horticultural pursuits.
- 501(c)(19): This subsection pertains to veterans’ organizations, including posts or organizations of past or present members of the armed forces of the United States. These organizations must be operated for the exclusive purpose of promoting the social welfare of veterans and their dependents.
- 501(c)(10): Domestic fraternal societies, orders, or associations operating under the lodge system are classified under this subsection. Similar to 501(c)(8), these organizations provide benefits to their members or their dependents.
- 501(c)(2): Title holding corporations or trusts, for exempt organizations, are covered under this subsection. These organizations typically hold title to property for the benefit of an exempt organization.
- 501(c)(13): Cemetery companies fall under this subsection, including organizations operated exclusively for the benefit of their members and meeting certain burial needs.
- 4947(a)(1): This subsection refers to certain non-exempt charitable trusts. These trusts are subject to taxation and must distribute their income for charitable purposes.
- 501(c)(9): Voluntary employees’ beneficiary associations (VEBAs) are covered under this subsection. These organizations provide benefits, such as life, sick, accident, or other benefits, to the members or their dependents.
- 501(c)(14): Credit unions or cooperative organizations that provide credit to members for agricultural purposes are classified under this subsection.
- 501(c)(1): This subsection pertains to corporations organized under an act of Congress that are operated for the exclusive purpose of providing assistance to the government or its agencies.
- 501(c)(12): Benevolent life insurance associations, mutual ditch or irrigation companies, mutual or cooperative telephone companies, and like organizations are covered under this subsection.
Each of these IRS subsections represents a specific category or type of nonprofit organization, each with its own eligibility criteria, tax benefits, and operational guidelines. Understanding these distinctions is essential for navigating the nonprofit sector and ensuring compliance with applicable regulations.
Below is the graphical representation of the IRS subsections mentioned above, illustrating the distribution of counts within each sector as reflected in our meticulously compiled data.

Subject Area Categories:
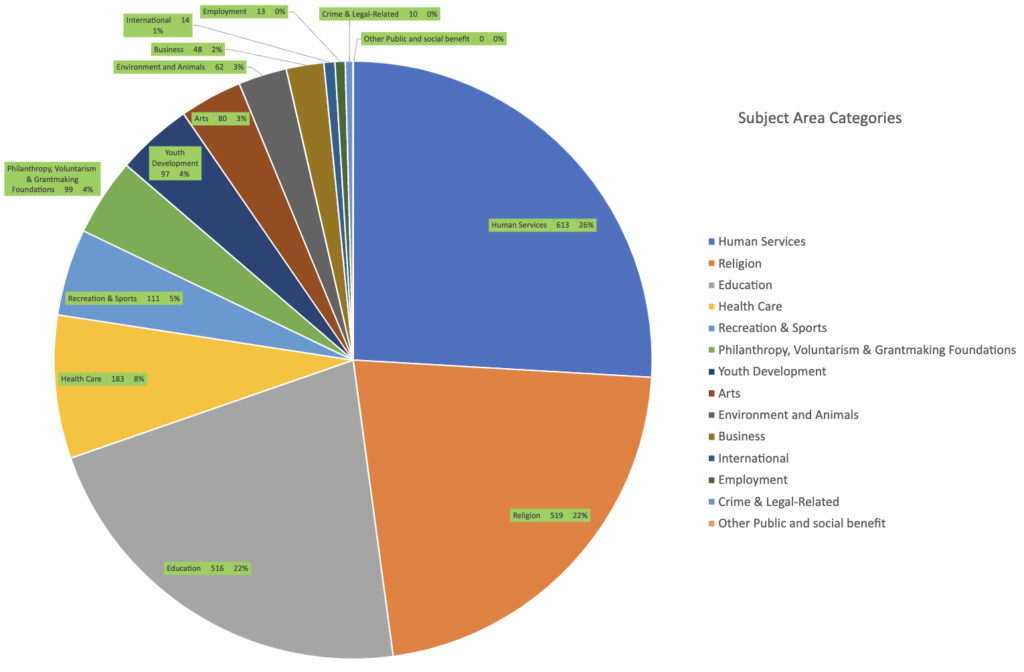
Nonprofit organizations are categorized based on their mission and goals, reflecting a diverse range of subject areas.These organizations are divided into distinct categories to represent their focus areas and activities.
Each category represents a specific sector or field in which nonprofit organizations operate, contributing to various aspects of society. The categories include :
- Human Services (613)
- Religion (519)
- Education (516)
- Health Care (183)
- Recreation & Sports (111)
- Philanthropy, Voluntarism & Grantmaking Foundations (99)
- Youth Development (97)
- Arts (80)
- Environment and Animals (62)
- Business (48)
- International (14)
- Employment (13)
- Crime & Legal-Related (10) and
- Other Public and social benefit (0).
The distribution of organizations across these categories is depicted in the pie chart, offering a visual representation of their relative proportions within the nonprofit sector
This pie chart enables stakeholders to gain insights into the distribution and focus areas of nonprofit organizations, highlighting the diversity and breadth of their impact.
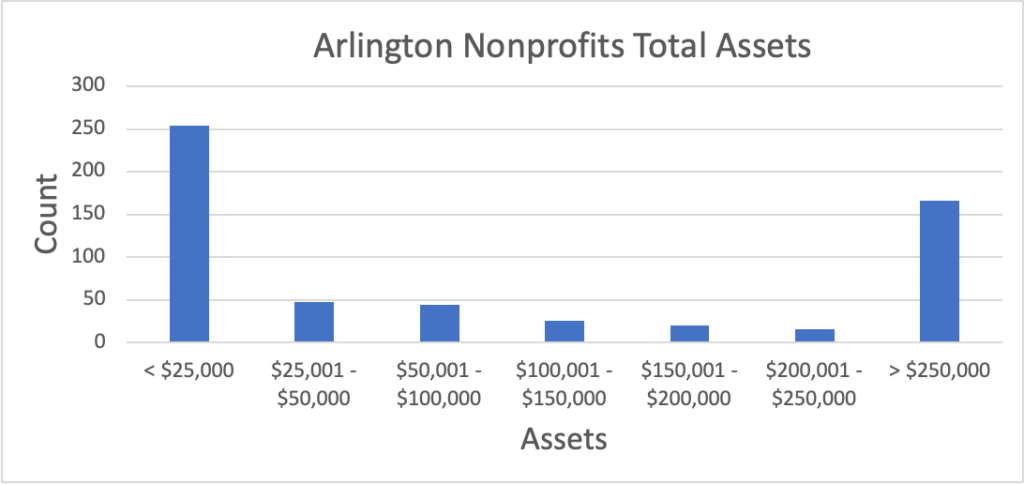
Total Assets:
- Total assets refer to the combined value of all tangible and intangible assets owned by a nonprofit organization. Tangible assets include cash, investments, property, equipment, and inventory. Intangible assets may include intellectual property, patents, trademarks, and goodwill.
- Reports detailing total assets are useful for assessing the financial health and resource capacity of a nonprofit organization. These reports against organization provide insights into the organization’s liquidity, investment portfolio, and overall financial stability. They also help stakeholders understand the organization’s wealth and its ability to fund programs and initiatives.
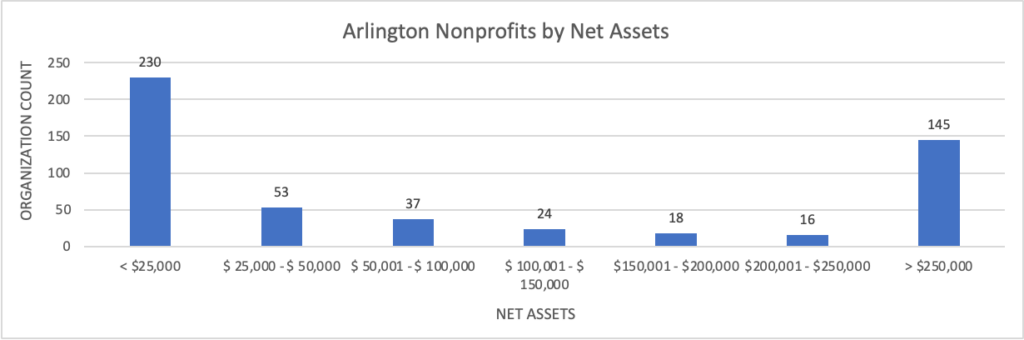
Net Assets:
- Net assets represent the difference between an organization’s total assets and its total liabilities. It is essentially the organization’s equity or the value of its assets that remain after accounting for all debts and obligations.
- Net assets reports are crucial for understanding the financial position and sustainability of a nonprofit organization. Positive net assets indicate financial stability and surplus, while negative net assets may signal financial distress or insolvency. These reports help stakeholders assess the organization’s ability to meet its long-term financial obligations and support its mission over time.
Total Revenues:
- Total revenue refers to the total amount of income generated by a nonprofit organization during a specific period. This includes donations, grants, membership fees, program fees, fundraising events, and any other sources of income.
- Reports on total revenue are essential for evaluating the financial performance and fundraising effectiveness of a nonprofit organization. They provide insights into the organization’s revenue streams, donor base, and fundraising strategies. By analyzing revenue trends over time, nonprofit leaders can identify successful fundraising channels and allocate resources effectively to support their mission.

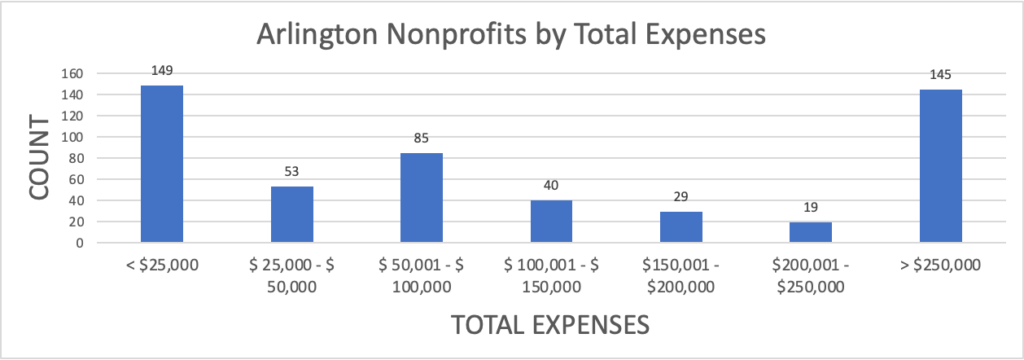
Total Expenses:
- Total expenses represent the sum of all costs incurred by a nonprofit organization during a specific period. This includes expenses related to programs and services, administrative costs, fundraising expenses, salaries and benefits, overhead, and any other operating expenses.
- Reports detailing total expenses help stakeholders understand how a nonprofit organization allocates its financial resources to support its mission and activities. They provide transparency into the organization’s spending patterns, cost structure, and efficiency in managing expenses. By analyzing expense breakdowns, nonprofit leaders can identify areas for cost-saving measures and optimize resource allocation to maximize impact.
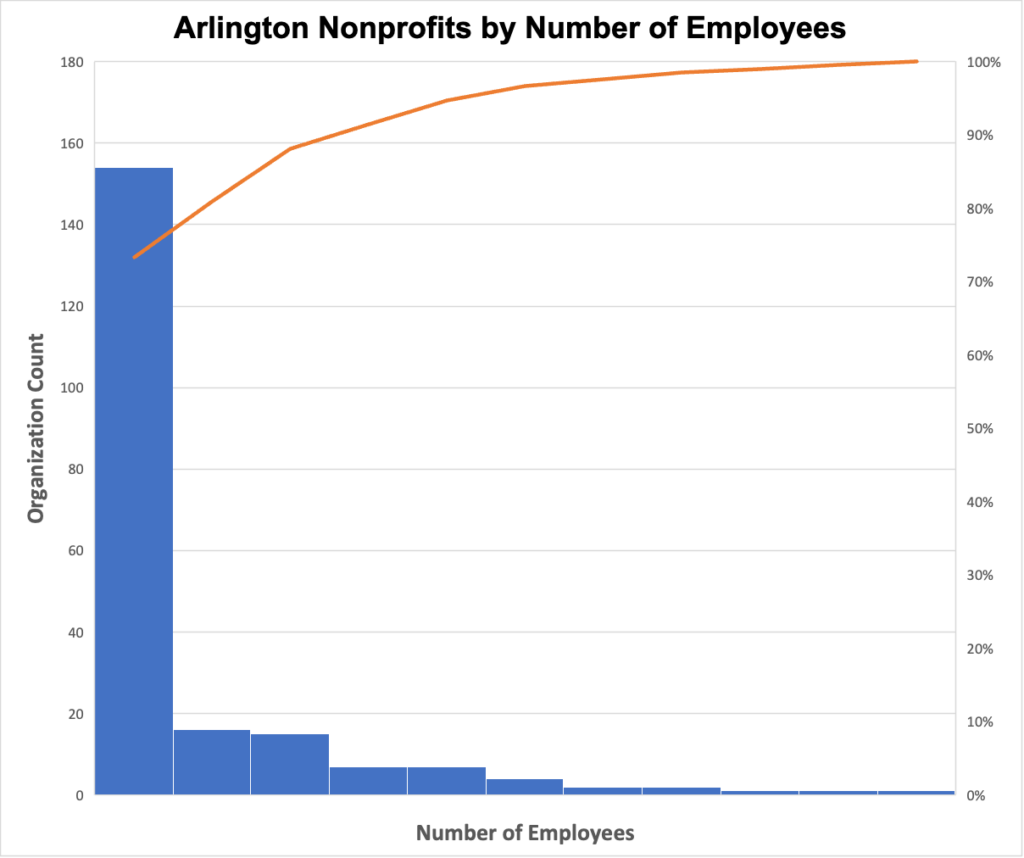
Number of Employees:
- The number of employees indicates the total count of individuals who are employed by a nonprofit organization. This includes full-time, part-time, and temporary staff members.
- Reports on the number of employees provide insights into the organization’s workforce size, composition, and human resource management practices. They help stakeholders understand the organization’s capacity to deliver programs and services, as well as its staffing needs and personnel expenses. By tracking employee numbers over time, nonprofit leaders can monitor workforce trends, assess staffing levels, and make informed decisions about hiring, training, and organizational development initiatives.
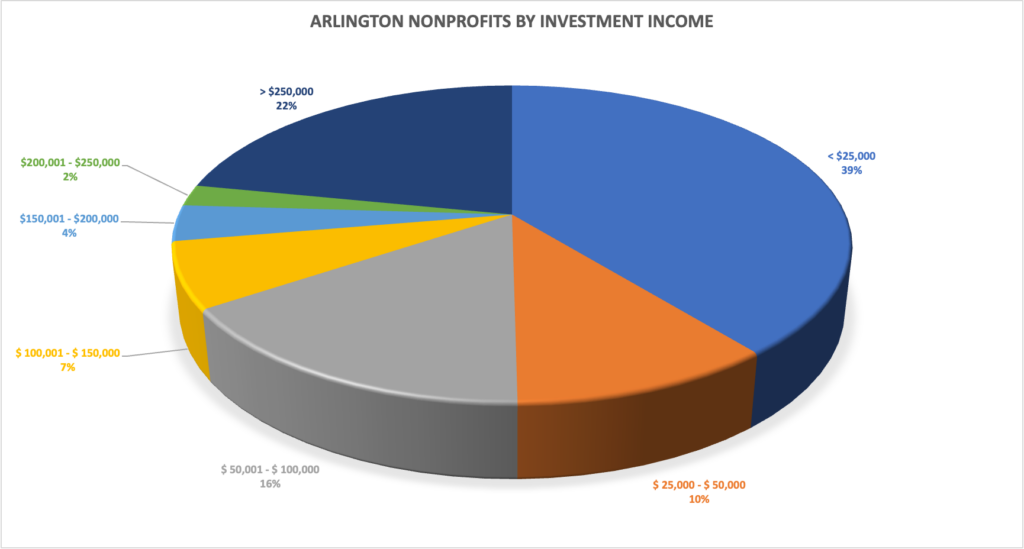
Investment Income:
- Investment income refers to the earnings generated from investments made by a nonprofit organization. These investments may include stocks, bonds, mutual funds, real estate, and other financial assets. Investment income typically includes dividends, interest, capital gains, and rental income earned from these investments.
- Reports on investment income are crucial for assessing the financial performance and diversification strategy of a nonprofit organization’s investment portfolio. They provide insights into the organization’s investment income sources, investment returns, and overall investment management effectiveness. By analyzing investment income trends over time, nonprofit leaders can evaluate the performance of their investment assets, assess investment risks, and make informed decisions about portfolio allocation and investment strategies.
Disclaimer: The presence of non-profit organizations on this website does not indicate an endorsement or recommendation from UTA